Introducing gNMIc Operator
Today we’re releasing gNMIc Operator: A Kubernetes operator that brings cloud-native lifecycle management to gNMIc telemetry collectors. It’s been a long road to get here, and I want to share a bit of the backstory.
An idea almost 4 years in the making TODO list
The idea was always clear: gNMIc should not only be a powerful CLI tool, but also a scalable, production-grade telemetry collector that could be orchestrated alongside the rest of your infrastructure. That led to multiple improvements to gNMIc (Clustering, Target Loaders,…), but one of them was a bit more ambitious than the others: A gNMIc Kubernetes operator.
To make sure I wouldn’t forget, I did what many of us do, I created a GitHub repository as a todo item. On April 14, 2022, the gnmic/operator repo was born (as karimra/gnmic-operator) with nothing more than a LICENSE, a .gitignore, and a one-line README. No code, no CRDs, no controllers. Just a placeholder.
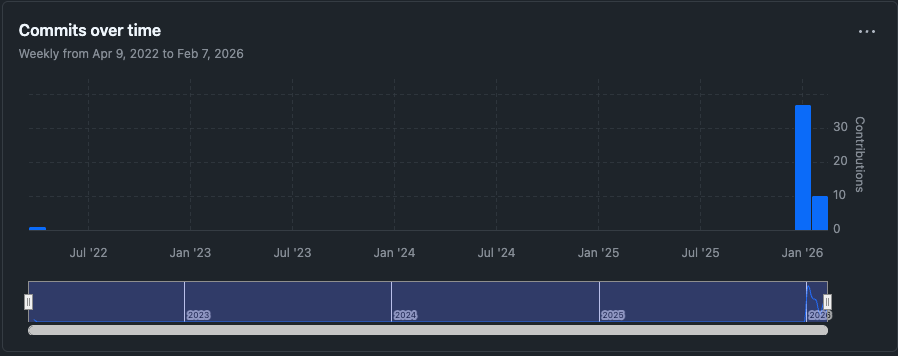
If you’ve ever created an empty repo just to claim the name and remind yourself “I’ll get to this,” you know the feeling.
Well, today that todo is finally checked off.
Why an operator? The configuration problem at scale
gNMIc is a versatile tool. With a single binary you can subscribe to gNMI paths, collect telemetry from dozens of network devices, and ship it to Prometheus, Kafka, NATS, InfluxDB, and more. For a small lab or a handful of routers, editing a YAML configuration file works perfectly well.
But what happens when you go from 10 devices to 100? Or 1,000?
At that scale, the configuration file approach starts to break down:
- Config files become unmanageable. A single gNMIc config for hundreds of targets, multiple subscriptions, and several outputs quickly grows into thousands of lines. One misplaced indent and your entire telemetry pipeline is down.
- Coordination is manual. Running multiple gNMIc instances for high availability means manually splitting targets across instances, keeping configs in sync, and handling failover yourself.
- Changes are risky. Updating a subscription or adding a new output means editing a file, validating it, and restarting the process across every instance. There’s no built-in way to roll out changes gradually.
- Config drift is inevitable. Without a reconciliation loop, files drift between instances and you end up with subtle inconsistencies that are painful to debug.
gNMIc’s clustering mode and target loaders alleviate some of this, but if you’ve spent any time following the project’s issue tracker, you know the most common ask has always been dynamic everything. Users want to update subscriptions on the fly, add or remove outputs at any time, all without restarting gNMIc or tearing down existing gNMI sessions.
We needed a better abstraction. One that lets you declare what telemetry you want and where it should go, without worrying about how configs are generated and distributed across instances.
Getting there required some not-so-small changes to gNMIc itself: A dynamic configuration store with watch capabilities, internal managers for each object type, and a new apply API to achieve true configuration idempotency. More on that in a future post.
Enter Kubernetes Custom Resources
Kubernetes already has a battle-tested framework for declarative, reconciled, API-driven configuration. By modeling each piece of the telemetry pipeline as a Custom Resource, we get all of that for free.
Here’s what the resource model looks like:
| Resource | What it represents |
|---|---|
| Cluster | A fleet of gNMIc collector pods (backed by a StatefulSet) |
| Target | A network device to collect telemetry from |
| TargetProfile | Shared credentials and connection settings |
| Subscription | What data to collect (gNMI paths, mode, interval) |
| Output | Where to send data (Prometheus, Kafka, NATS, etc.) |
| Pipeline | The glue: connects targets, subscriptions, and outputs |
Note: There are additional custom resources available beyond those listed here. Check the documentation for a full overview and details on how to use them.
Instead of one monolithic config file, each concern is a separate, versionable, RBAC-controlled resource. You can manage them independently, apply them with kubectl, and integrate them into your GitOps workflows.
A quick taste
Here’s how you set up telemetry collection with the operator.
Define a target:
apiVersion: operator.gnmic.dev/v1alpha1
kind: Target
metadata:
  name: router1
  labels:
    role: core
spec:
  address: 10.0.0.1:57400
  profile: default-profile
Create a subscription:
apiVersion: operator.gnmic.dev/v1alpha1
kind: Subscription
metadata:
  name: interface-counters
  labels:
    type: interfaces
spec:
  paths:
    - /interfaces/interface/state/counters
  mode: STREAM/SAMPLE
  sampleInterval: 10s
Configure an output:
apiVersion: operator.gnmic.dev/v1alpha1
kind: Output
metadata:
  name: prometheus
  labels:
    type: metrics
spec:
  type: prometheus
Wire everything together with a Pipeline:
apiVersion: operator.gnmic.dev/v1alpha1
kind: Pipeline
metadata:
  name: core-telemetry
spec:
  clusterRef: gnmic-cluster
  enabled: true
  targetSelectors:
    - matchLabels:
        role: core
  subscriptionSelectors:
    - matchLabels:
        type: interfaces
  outputs:
    outputSelectors:
      - matchLabels:
          type: metrics
Deploy the collectors:
apiVersion: operator.gnmic.dev/v1alpha1
kind: Cluster
metadata:
  name: gnmic-cluster
spec:
  replicas: 3
  image: ghcr.io/openconfig/gnmic:latest
That’s it. The operator takes care of the rest:
- Creates a StatefulSet with 3 gNMIc pods
- Generates the configuration for each pod
- Distributes targets across pods
- Exposes Prometheus metrics endpoints
- Reconciles any changes you make to the resources, no restarts required
What the operator gives you
Declarative, versionable configuration
Your entire telemetry infrastructure is defined as Kubernetes resources. Store them in Git, review changes in pull requests, roll back with git revert. No more SSH-ing into boxes to fix a config typo.
Automatic target distribution
The operator uses a hashing algorithm to spread targets evenly across collector pods. Scale your Cluster from 3 to 5 replicas, and targets automatically rebalance no manual intervention.
Dynamic reconfiguration
When you update a Subscription or add a new Output, the operator pushes the changes to gNMIc pods via their REST API. The pods pick up the new config without restarting, so there’s no gap in telemetry collection.
Native Kubernetes integration
- Secret Management: Credentials live in Kubernetes Secrets, not in plain-text config files
- TLS/mTLS: Automatic certificate management via cert-manager
- Service Discovery: Reference Kubernetes Services for output destinations
- RBAC: Control who can create or modify targets, subscriptions, and outputs
Multiple output types
Prometheus, Kafka, NATS, InfluxDB, and more. All configurable as Custom Resources. Different pipelines can route different telemetry flows to different destinations.
Getting started
Install the operator with a single command:
kubectl apply -f https://github.com/gnmic/operator/releases/latest/download/install.yaml
Or using Helm:
helm install gnmic-operator oci://ghcr.io/gnmic/operator/charts/gnmic-operator \
  --namespace gnmic-system \
  --create-namespace
Check out the Quick Start Guide for a full walkthrough.
What’s next
This is just the beginning. Here’s what we’re working on:
- Enhanced observability with detailed operator metrics
- Advanced target discovery
- Kubernetes-native autoscaling
- More examples and documentation
Get involved
gNMIc Operator is open source under the Apache 2.0 license. We’d love your feedback, bug reports, and contributions:
- GitHub: github.com/gnmic/operator
- Docs: operator.gnmic.dev
- gNMIc: gnmic.openconfig.net
That empty repo from 2022 finally has some code in it. Only took four years :) Time to take it for a test drive.